To anyone who is not a statistician, data can seem pretty boring until it’s put in a digestible and useful context.
Engineers love data points and so do we. But AE2S Communications, we realize when we see data, it’s more than just numbers. It’s real people, not just probabilities. Data is derived from real life. The numbers represent things that affect real people like our families, our communities and our clients.
Our goal as communicators is finding the human element behind important projects and technical information. Why does this project matter? Who can benefit from this technical information? Who needs to know this information?
Enter stage left, the wonderful tool known as an infographic. An infographic does the hard work of presenting data in a way that helps people see and understand complex information.
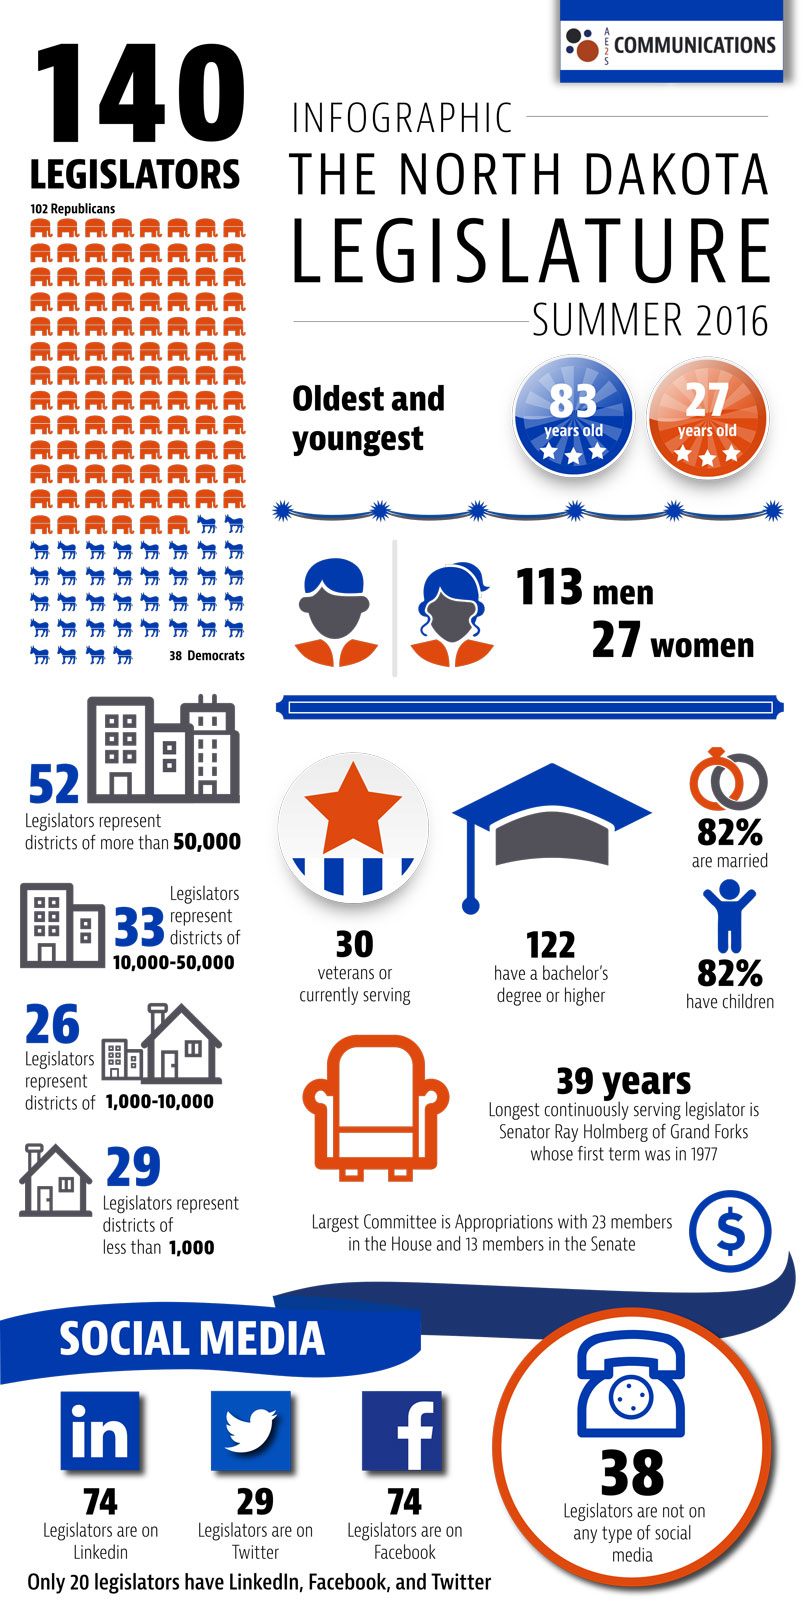
Take for example, our recent infographic about the North Dakota Legislature. As a whole, there are many data points about the legislative body. The breakdown between party, gender and even age are important in understanding the group, but really too vague to really connect with on a personal level. But take the time to call out the fact that 82% of North Dakota’s legislators have children and the longest continuously serving candidate has been there since 1977, and you have your connection points.
Every person has a unique story and that story helps make up many sets of data. A great infographic will display the data and a few of the stories at the same time.
Think about the projects you are working on right now. What data needs to connect with a target audience? Is there room for using an infographic? Start by asking the questions your target audience wants to know and move forward by answering those questions with data. Add some visual representations and you are on your way.
Data-driven infographics can make a big impact. So get a little creative and find a designer. It’s time to make your data communicate.